__STYLES__
Tools used in this project
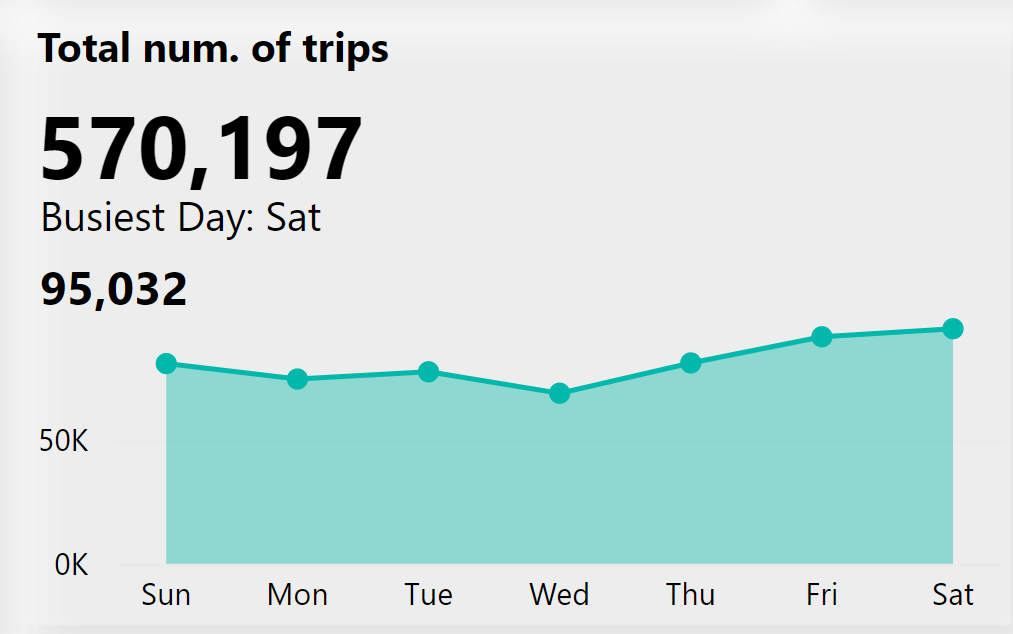
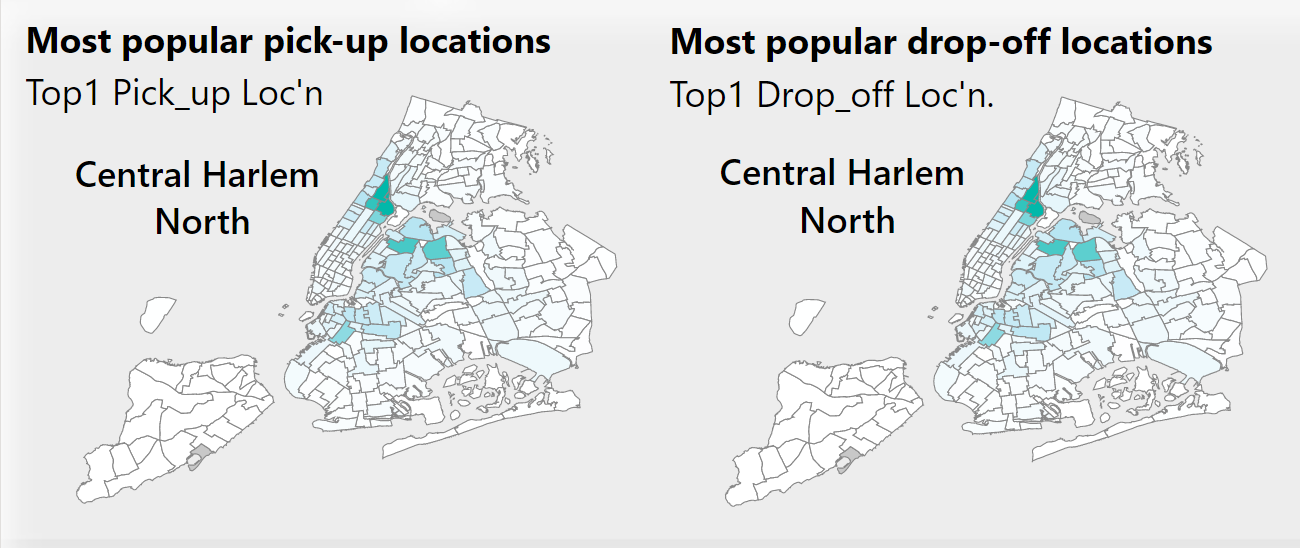
NYC Taxi Trips Analysis

This is the embedded media

About this project

Overview

This project provides an understanding of historical trips for all Green Taxis in New York City, NYC (2017 – 2020)

About the Dataset

The dataset contains trip records from all green taxis in NYC from 2017 to 2020. Records include fields capturing pick-up and drop-off dates/times, pick-up and drop-off locations, trip distances, itemized fares, rate types, payment types, and driver-reported passenger counts. (Source: NYC Taxi & Limousine Commission)

Challenge Prompt (Recommended Analysis)

  1. What is the average number of trips per week?
  2. What is the average distance traveled per tip?
  3. Which days of the week and times of the day will be busiest?
  4. What are the most popular pick-up and drop-off locations?

ETL and Data Modeling

Loading a dataset with 28,327,624 number of records to power bi was a challenge. I used Python for the data cleaning and removal of columns I will not be using for the analysis. This made the dataset easier to load in Power BI for the analysis.

Insights

  1. the Green taxi cabs covered a total of 570,197 trips with an average of 142,549 trips per week. (fiscal week 7, 2017-2020)
  2. Saturdays are busiest with a total of 95,032 trips.
  3. Busiest times were Post meridiem (PM) times having 66% of total trips with peaked hours at 6pm.
  4. Central Harlem North is the Most popular pick-up and drop-off location

Additional project images

Total number of trips by Weekday
Total number of trips by Time (Hour)
Change in trip volume relative last fiscal week by Weekday
Action points
Predictions
Discussion and feedback(0 comments)
2000 characters remaining